eBird, a well-established joint project by Audubon and Cornell Lab of Ornithology, allows birders to organize their sightings, share them with others, and look up maps and records for specific species. But it’s not a glorified bird diary. Tools like eBird help birds by aiding in important studies all while shifting citizen science to something more like community science thanks to annual counting events (that sometimes, as you’ll see, come with chili).
Audubon’s science work relies big time on those community science events. Think Climate Watch, the Great Backyard Bird Count, and the world-famous Christmas Bird Count. Information entered during these events not only promotes community gatherings but helps researchers examine widespread trends in bird populations and migration.
Here’s your guide to how utilizing eBird trickles down to science work—with a sprinkle of holiday vibes folded in.

A Bit of eBird History
I’ll be the first to admit, I came to eBird relatively late. It was during the Great Backyard Bird Count in February 2022. I was with Juneau Audubon Society member Marsha Squires at Fish Creek on Douglas Island in Southeast Alaska. We had come upon a mass of waterfowl, prompting Marsha to break out the scope. She called out species and their numbers as I logged them on her phone’s eBird app. We got to track the number of species we were seeing, add our location, and submit our count to “help scientists better understand and protect birds around the world.” And it was great fun.
But eBird makes it so anyone can contribute bird sightings to science at any time of the year, not just frigid February mornings. You can log not just bird sightings, but also calls heard (which has made eBird natural bedfellows with Merlin Bird ID—which is kind of like the Shazam app for bird calls—and the Audubon Bird Guide App if you’re having trouble identifying any individuals).
To underscore the gravity of how cool these tools are, and how righteous it is to be able to contribute to science while on a morning dog walk, I turn to my favorite bird author Scott Weidensal.
“No one planned for eBird to take over the world. It just sort of happened. The birding world, at least,” he writes in A World on the Wing. “When eBird was launched in 2002, a joint project of the Cornell Lab of Ornithology and the National Audubon Society, it was seen by its creators as a citizen-science portal, where interested birders could provide sighting data that would help researchers better understand bird populations and movements.”
But a lot has happened since 2002, which has only made eBird more powerful.

How to Use eBird
In the before smartphone times, many birders headed out with their usual notebooks, counted, and settled in for a session of data entry once they got to a computer. This is still done (and Alaska has its own regional portal at Alaska eBird) and, in fact, more than 1.5 billion records have been crowdsourced from bird nerds over the past two decades.
But that figure is in large part thanks to eBird mobile hitting the scene in 2015 (which is free and available in 27 languages on iOS and Android). Nowadays, birders often log sightings in real time through their phones.
How to get started? First, we recommend going to the source: eBird. The “Get Started with eBird” webpage outlines five key steps to eBirding with grace, from creating an account to utilizing best practices. Audubon Magazine also published “A Beginner’s Guide to Using eBird,” which is a deeper dive into how birders and scientists alike can harness the power of this important platform.
Finally, our friends at the Alaska Chapter of Backcountry Hunters and Anglers recently created an eBird app guide to demonstrate how the tool can “further citizen science efforts in bird hunting species and habitat conservation.”
eBird Work in Alaska
By reviewing the 2022 study, “Small sight—Big might” we can see how “about 12,000 eBird app users reported over 358,000 bird observations” since the May 2007 launch of Alaska eBird.
And a major way eBird comes into play for Alaska’s birds is through the Audubon-generated Migration Passage Analysis.
“When the [Audubon] Science Team conducts a migration passage analysis, we use the eBird Status and Trend weekly abundance maps that describe the abundance of birds during each week of the year,” says Nat Seavy, Audubon’s Director of Migration Science. “We identify an area (for example, the Chilkat Bald Eagle Preserve IBA) and then for every week of the year, we quantify the proportion of the total abundance of a species that occurs within that specific area. If we have an estimate of the total population size, then we can convert that to an estimated number of birds.” (You can read a detailed description of how the Audubon Science Team performed a Migration Passage Analysis here.)
And this is actionable information we’re giving you here.
For instance, in Southeast Alaska, one Juneauite is asking for folks to use eBird to count bird species on the northeastern side of Douglas Island to fill a gap in data. This is needed to showcase how Taashuyee-Chookan.aani, or the Mendenhall Wetlands State Game Refuge—a globally recognized Important Bird Area and majorly important stopover site for birds migrating through the area—supports wildlife activity. This is important because a major development project (namely the Juneau Douglas Second Crossing) has been looming over this vital wetlands complex since the 1980s, and conservation groups in the area and beyond have been warding off construction all the while.
Alaska is also ground zero for many migratory bird species, the routes of which can be watched lava-lamp-like via Audubon’s Bird Migration Explorer.
“The Cornell Lab of Ornithology was an important partner in the development of the Bird Migration Explorer because their eBird Status and Trend data products are an important tool for visualizing bird migration,” Seavy says. “In the species migration maps, the eBird weekly abundance information shows the migratory movements of the entire population.”
To drill down, Seavy says this is especially important for species like the Varied Thrush, for which there is no tracking information available. The eBird weekly abundance maps are also used in the conservation challenge maps on the Bird Migration Explorer. These maps show where migratory birds encounter conservation challenges as they move across the hemisphere. For example, this map shows where Dunlin occur in areas at risk from sea-level rise.
And if these maps seem overly impressive, just remember Seavy’s words: “Anybody who has ever submitted an eBird checklist has played a role in building the Bird Migration Explorer.”
How eBird Fuels Community Science
We’ve mentioned the global program that is the Great Backyard Bird Count, for which Audubon also collaborates with the Cornell Lab of Ornithology and Birds Canada. Then there’s Climate Watch (more on that later). But the biggest example of how eBird builds community is the Christmas Bird Count (CBC). Each year from December 14 to January 5, CBC participants are encouraged to tally all birds seen or heard that day and ensure they’re entered into the CBC database. This annual wave of data helps to provide a clear idea of the health of particular bird populations.
CBC to 1900 when ornithologist Frank M. Chapman proposed a new holiday tradition, a “Christmas Bird Census,” that would count birds during the holiday season versus shooting them. He was an early officer in the then-nascent Audubon Society. Today, tens of thousands of birders participate in CBC, adding to more than a century’s worth of bird data.
Last year was the 124th CBC, and it was “a record-breaker in many ways” according to Audubon’s Community Science Manager Cooper Farr. There were 2,677 counts completed (470 in Canada, 2,019 in the United States, and 188 in Latin America, the Caribbean, and the Pacific Islands) and 83,186 participants (72,129 field observers and 11,057 feeder watchers) who documented 2,380 species—totaling 40,871,030 birds.
“To all of the participants, compilers, and regional editors who spend hours each year counting birds, compiling, submitting, and reviewing data to make this program a success—thank you!” Farr writes. “We truly couldn’t do this without you.”
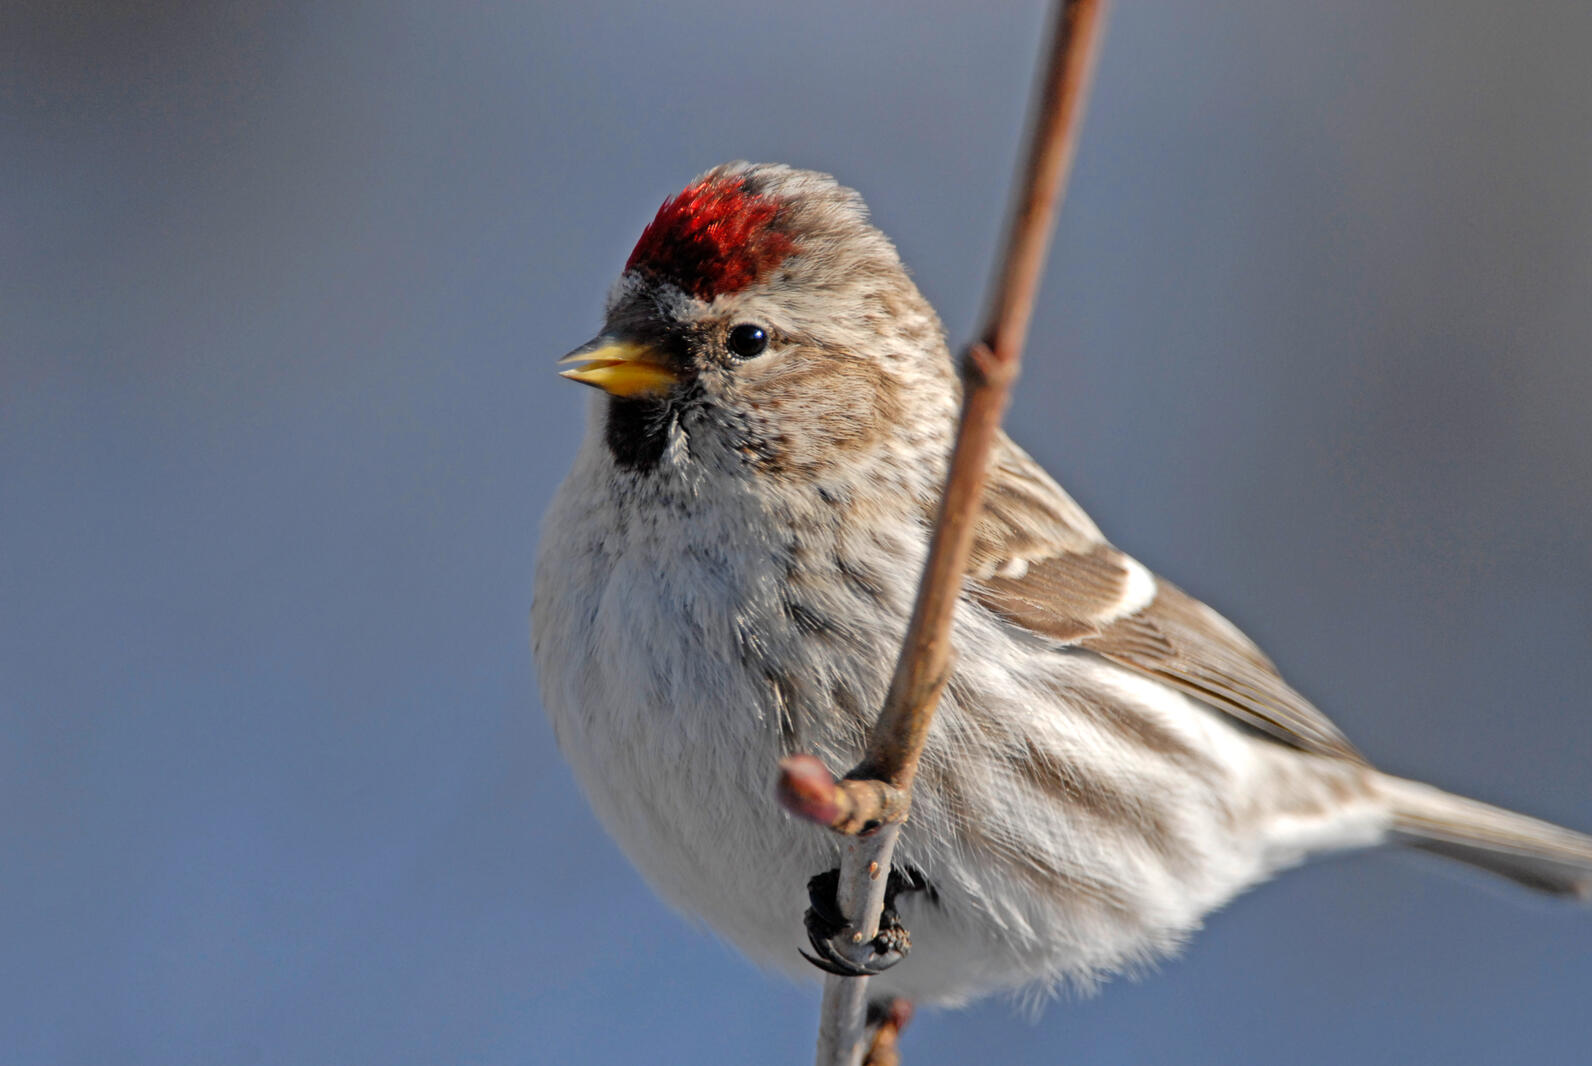
And CBCs happen throughout Alaska, too. From Haines to Homer, Nome to Naknek, Tok to Unalaska, Alaskan birders grouped in “circles” (a 15-mile radius led by a CBC compiler) to count birds. There was a big one in Anchorage, newsworthy even, thanks to an invasion of Redpolls. A total of 4,180 Redpolls were spotted in Anchorage during the 2023/2024 CBC, the highest tally in at least a decade, and more Redpolls than were counted in any other Audubon circle in all of North America (which we know thanks to the submitted data).
Louann Feldmann has been the Compiler and Coordinator for the Anchorage Audubon Society’s CBC for 11 years. She says Anchorage’s CBC has been a popular community event since commencing in 1941, and for the past decade has seen 150 to 180 participants, which “include feeder watchers as well as field observers.” She says up to 60 people then attend their CBC Tally Party—which usually involves chili—to watch and contribute to the results being entered into a spreadsheet that is then submitted to National Audubon Society.
“Citizen science increases interest in our environment by allowing people to observe and report the observations they have. It personalizes the data,” Feldmann says. “That encourages them to become interested and possibly involved in community proposals that might have negative or positive effects on local species.”
So not only does the CBC give participants a festive, hot cocoa feeling each holiday season, but the data collected allows researchers, conservation biologists, wildlife agencies, and other interested individuals to study the long-term status of bird populations across North America year-round. The data has been used in hundreds of scientific studies, including those that tell us how birds are faring with climate change (more on that later).
“I think eBird encourages its users to keep track of birds they have seen and to learn about unusual birds that are spotted and reported,” she says. “Unusual reported sightings of a species increasing or decreasing over years may be a first-hand experience of changing migration patterns due to climate change or other human effects on birds.”
And a major (and relatively recent) example of those “human effects on birds” would have to be the 3 Billion Birds study.
How Community Science Leads to Important Studies
Over the decades, Audubon’s CBC data have been used in more than 300 peer-reviewed articles, including the Science piece from 2019 detailing the steady loss of nearly three billion North American birds since 1970.
This mostly proves how community scientists are fundamental to Audubon’s work to improve the lives of birds, especially as a founding partner with the Cornell Lab of Ornithology on eBird.
“One of the ways the [Audubon] Science Team uses eBird data is through the eBird Status and Trends data products that have been developed by the Cornell Lab of Ornithology,” Seavy says. “To develop these products, the eBird Science Team at Cornell compiles data from eBird checklists with high-resolution satellite imagery into sophisticated statistical models to predict when, where, and in what numbers species occur every week of the year.”
Overall, eBird data is a tremendous resource for science and conservation, simply because when birders submit a checklist to eBird, “you make your observations available to the global community of researchers,” or so says this impressive webpage on the eBird site that lists more than 930 publications where eBird data has been put to use. Data reported by community scientists have been used by researchers since the 1930s to report on the health of bird populations. Audubon’s scientists have used it in creating innovative analytical methods that include our CBC population status and trends and learning how birds are responding to a changing climate.
Audubon’s community-involved climate work includes the aforementioned Climate Watch, a program to track the near-real-time response of 12 species to a changing climate. The next survey will take place from January 15 to February 15, 2025, and is open to the public.
So if you miss CBC, or want to create a New Year’s resolution about being a better community scientist, another event designed to improve the lives of birds is right around the corner.


